ChIPseeker is an R package for annotating, comparison and visualizationChIP-seq(Chromatin immunoprecipitation high-throughput sequencing) data analysis.
It supports annotating ChIP peaks and provides functions to visualize ChIP peaks coverage over chromosomes and profiles of peaks binding to TSS regions.Comparison of ChIP peak profiles and annotation are also supported. Moreover, it supports evaluating significant overlap among ChIP-seq datasets.
Currently, ChIPseeker contains 17,000 bed file information from GEO database. These datasets can be downloaded and compare with user’s own data to explore significant overlap datasets for inferring co-regulation or transcription factor complex for further investigation.
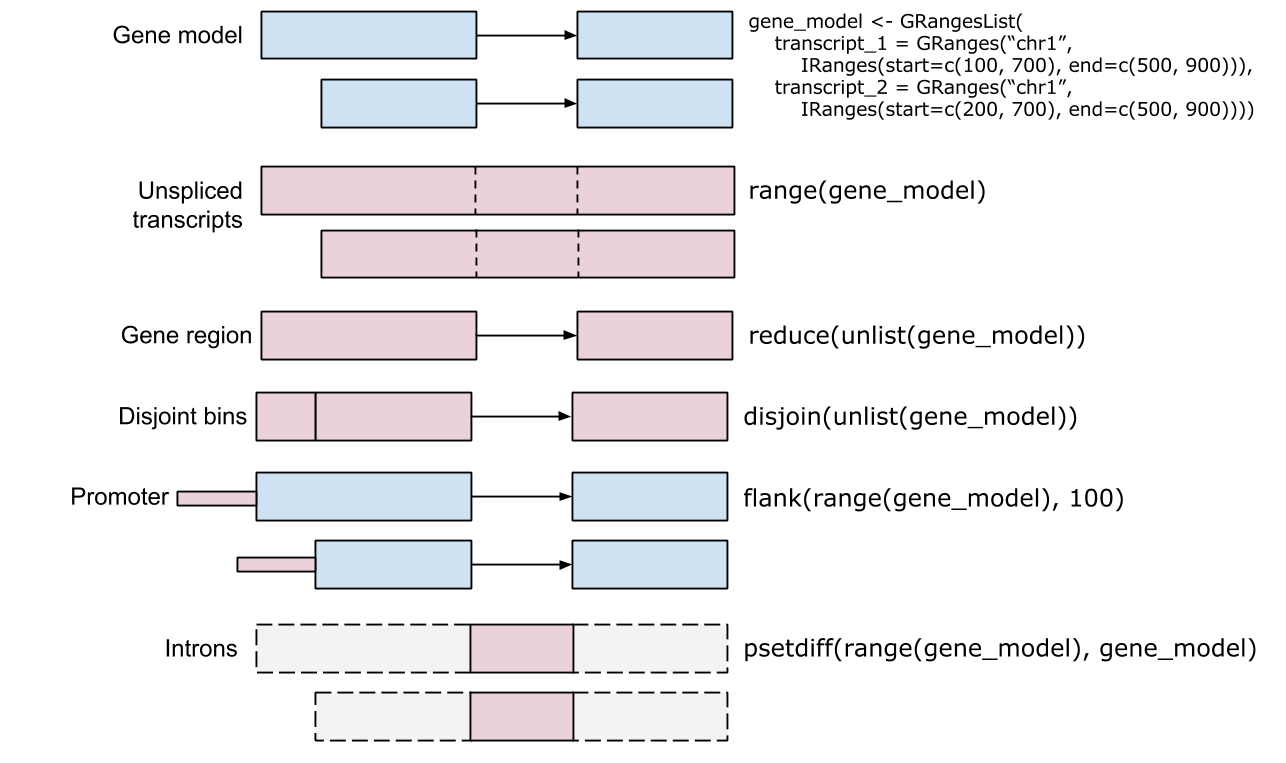
First of all, for calculating the profile of ChIP peaks binding to TSS regions, we should prepare the TSS regions, which are defined as the flanking sequence of the TSS sites. Then align the peaks that are mapping to these regions, and generate the tagMatrix.
In the above code, tagMatrix is not restricted to TSS regions. The regions can be other types that defined by the user.
## tagMatrix is a Large matrix which contains about 4000000 elements
promoter <-getPromoters(TxDb=txdb, upstream=3000, downstream=3000)
tagMatrix <-getTagMatrix(peak, windows=promoter)
annotatePeak report detail information when the annotation is Exon or Intron, for instance “Exon (uc002sbe.3/9736, exon 69 of 80)”, means that the peak is overlap with an Exon of transcript uc002sbe.3, and the corresponding Entrez gene ID is 9736 (Transcripts that belong to the same gene ID may differ in splice events), and this overlaped exon is the 69th exon of the 80 exons that this transcript uc002sbe.3 prossess.
Parameter annoDb is optional, if provided, extra columns including SYMBOL, GENENAME, ENSEMBL/ENTREZID will be added. The geneId column in annotation output will be consistent with the geneID in TxDb. If it is ENTREZID, ENSEMBL will be added if annoDb is provided, while if it is ENSEMBL ID, ENTREZID will be added.
Visualize Genomic Annotation
plotAnnoBar(peakAnno)
Genomic Annotation by barplot
vennpie(peakAnno)
Genomic Annotation by vennpie
upsetplot(peakAnno, vennpie=TRUE)
The distance from the peak (binding site) to the TSS of the nearest gene is calculated by annotatePeak and reported in the output. We provide plotDistToTSS to calculate the percentage of binding sites upstream and downstream from the TSS of the nearest genes, and visualize the distribution.
plotDistToTSS(peakAnno,
              title="Distribution of transcription factor-binding loci\nrelative to TSS")
Functional enrichment analysis
Perform functional enrichment analysis to identify predominant biological themes among these genes by incorporating biological knowledge provided by biological ontologies. For instance, Gene Ontology (GO) annotates genes to biological processes, molecular functions, and cellular components in a directed acyclic graph structure, Kyoto Encyclopedia of Genes and Genomes (KEGG) annotates genes to pathways, Disease Ontology (DO) annotates genes with human disease association, and Reactome10 annotates gene to pathways and reactions.
ChIPseeker provides a function, seq2gene, for linking genomc regions to genes in a many-to-many mapping. It consider host gene (exon/intron), promoter region and flanking gene from intergenic region that may under control via cis-regulation. This function is designed to link both coding and non-coding genomic regions to coding genes and facilitate functional analysis.
Profile of several ChIP peak data binding to TSS region
Function plotAvgProf and tagHeatmap can accept a list of tagMatrix and visualize profile or heatmap among several ChIP experiments, while plotAvgProf2 and peakHeatmap can accept a list of bed files and perform the same task in one step.
## promoter <- getPromoters(TxDb=txdb, upstream=3000, downstream=3000)
## tagMatrixList <- lapply(files, getTagMatrix, windows=promoter)
##
## to speed up the compilation of this vigenette, we load a precaculated tagMatrixList
data("tagMatrixList")
plotAvgProf(tagMatrixList[1:3], xlim=c(-3000, 3000))
## >> Running bootstrapping for tag matrix...        2018-04-18 21:36:38
## >> Running bootstrapping for tag matrix...        2018-04-18 21:36:42
## >> Running bootstrapping for tag matrix...        2018-04-18 21:36:46
## >> Running bootstrapping for tag matrix...        2018-04-18 21:37:28
## >> Running bootstrapping for tag matrix...        2018-04-18 21:38:22
To compare the overlap peaks of replicate experiments or from different experiments, peak2GRanges can read peak file and stored in GRanges object. Several files can be read simultaneously using lapply, and then passed to vennplot to calculate their overlap and draw venn plot.
Overlap is very important, if two ChIP experiment by two different proteins overlap in a large fraction of their peaks, they may cooperative in regulation. Calculating the overlap is only touch the surface.
Shuffle genome coordination
p <-GRanges(seqnames=c("chr1", "chr3"),
ranges=IRanges(start=c(1, 100), end=c(50, 130)))
## Randomly permute the genomic locations of ChIP peaks defined in a genome which stored in TxDb object
shuffle(p, TxDb=txdb)
## GRanges object with 2 ranges and 0 metadata columns:
##       seqnames                 ranges strand
##          <Rle>              <IRanges>  <Rle>
##   [1]     chr1 [153088833, 153088882]      *
##   [2]     chr3 [183428672, 183428702]      *
##   -
##   seqinfo: 2 sequences from an unspecified genome; no seqlengths
Peak overlap enrichment analysis
With the ease of this shuffle method, we can generate thousands of random ChIP data and calculate the background null distribution of the overlap among ChIP data sets.
Parameter queryPeak is the query ChIP data, while targetPeak is bed file name or a vector of bed file names from comparison; nShuffle is the number to shuffle the peaks in targetPeak. To speed up the compilation of this vignettes, we only set nShuffle to 50 as an example for only demonstration. User should set the number to 1000 or above for more robust result. Parameter chainFile are chain file name for mapping the targetPeak to the genome version consistent with queryPeak when their genome version are different. This creat the possibility of comparison among different genome version and cross species.
In the output, qSample is the name of queryPeak and qLen is the the number of peaks in queryPeak. N_OL is the number of overlap between queryPeak and targetPeak.
# If simplify is set to FALSE, extra information including source_name, extract_protocol, description, data_processing and submission_date will be incorporated.
hg19 <-getGEOInfo(genome="hg19", simplify=TRUE)
head(hg19)
##     series_id        gsm     organism
## 111  GSE16256  GSM521889 Homo sapiens
## 112  GSE16256  GSM521887 Homo sapiens
## 113  GSE16256  GSM521883 Homo sapiens
## 114  GSE16256 GSM1010966 Homo sapiens
## 115  GSE16256  GSM896166 Homo sapiens
## 116  GSE16256  GSM910577 Homo sapiens
##                                                                                                       title
## 111          Reference Epigenome: ChIP-Seq Analysis of H3K27me3 in IMR90 Cells; renlab.H3K27me3.IMR90-02.01
## 112            Reference Epigenome: ChIP-Seq Analysis of H3K27ac in IMR90 Cells; renlab.H3K27ac.IMR90-03.01
## 113            Reference Epigenome: ChIP-Seq Analysis of H3K14ac in IMR90 Cells; renlab.H3K14ac.IMR90-02.01
## 114                      polyA RNA sequencing of STL003 Pancreas Cultured Cells; polyA-RNA-seq_STL003PA_r1a
## 115          Reference Epigenome: ChIP-Seq Analysis of H4K8ac in hESC H1 Cells; renlab.H4K8ac.hESC.H1.01.01
## 116 Reference Epigenome: ChIP-Seq Analysis of H3K4me1 in Human Spleen Tissue; renlab.H3K4me1.STL003SX.01.01
##                                                                                                     supplementary_file
## 111         ftp://ftp.ncbi.nlm.nih.gov/geo/samples/GSM521nnn/GSM521889/suppl/GSM521889_UCSD.IMR90.H3K27me3.SK05.bed.gz
## 112          ftp://ftp.ncbi.nlm.nih.gov/geo/samples/GSM521nnn/GSM521887/suppl/GSM521887_UCSD.IMR90.H3K27ac.YL58.bed.gz
## 113          ftp://ftp.ncbi.nlm.nih.gov/geo/samples/GSM521nnn/GSM521883/suppl/GSM521883_UCSD.IMR90.H3K14ac.SK17.bed.gz
## 114 ftp://ftp.ncbi.nlm.nih.gov/geo/samples/GSM1010nnn/GSM1010966/suppl/GSM1010966_UCSD.Pancreas.mRNA-Seq.STL003.bed.gz
## 115              ftp://ftp.ncbi.nlm.nih.gov/geo/samples/GSM896nnn/GSM896166/suppl/GSM896166_UCSD.H1.H4K8ac.AY17.bed.gz
## 116       ftp://ftp.ncbi.nlm.nih.gov/geo/samples/GSM910nnn/GSM910577/suppl/GSM910577_UCSD.Spleen.H3K4me1.STL003.bed.gz
##     genomeVersion pubmed_id
## 111          hg19  19829295
## 112          hg19  19829295
## 113          hg19  19829295
## 114          hg19  19829295
## 115          hg19  19829295
## 116          hg19  19829295
ChIPseeker provide function downloadGEObedFiles to download all the bed files of a particular genome.
After download the bed files from GEO, we can pass them to enrichPeakOverlap for testing the significant of overlap. Parameter targetPeak can be the folder, e.g. hg19, that containing bed files. enrichPeakOverlap will parse the folder and compare all the bed files. It is possible to test the overlap with bed files that are mapping to different genome or different genome versions, enrichPeakOverlap provide a parameter chainFile that can pass a chain file and liftOver the targetPeak to the genome version consistent with queryPeak.
Signifcant overlap can be use to generate hypothesis of cooperative regulation.By mining the data deposited in GEO, we can identify some putative complex or interacted regulators in gene expression regulation or chromsome remodelling for further validation.


 ## Profile of ChIP peaks binding to start site of Exon/Intron


 ## ChIP peak annotation comparision