R Error Bar
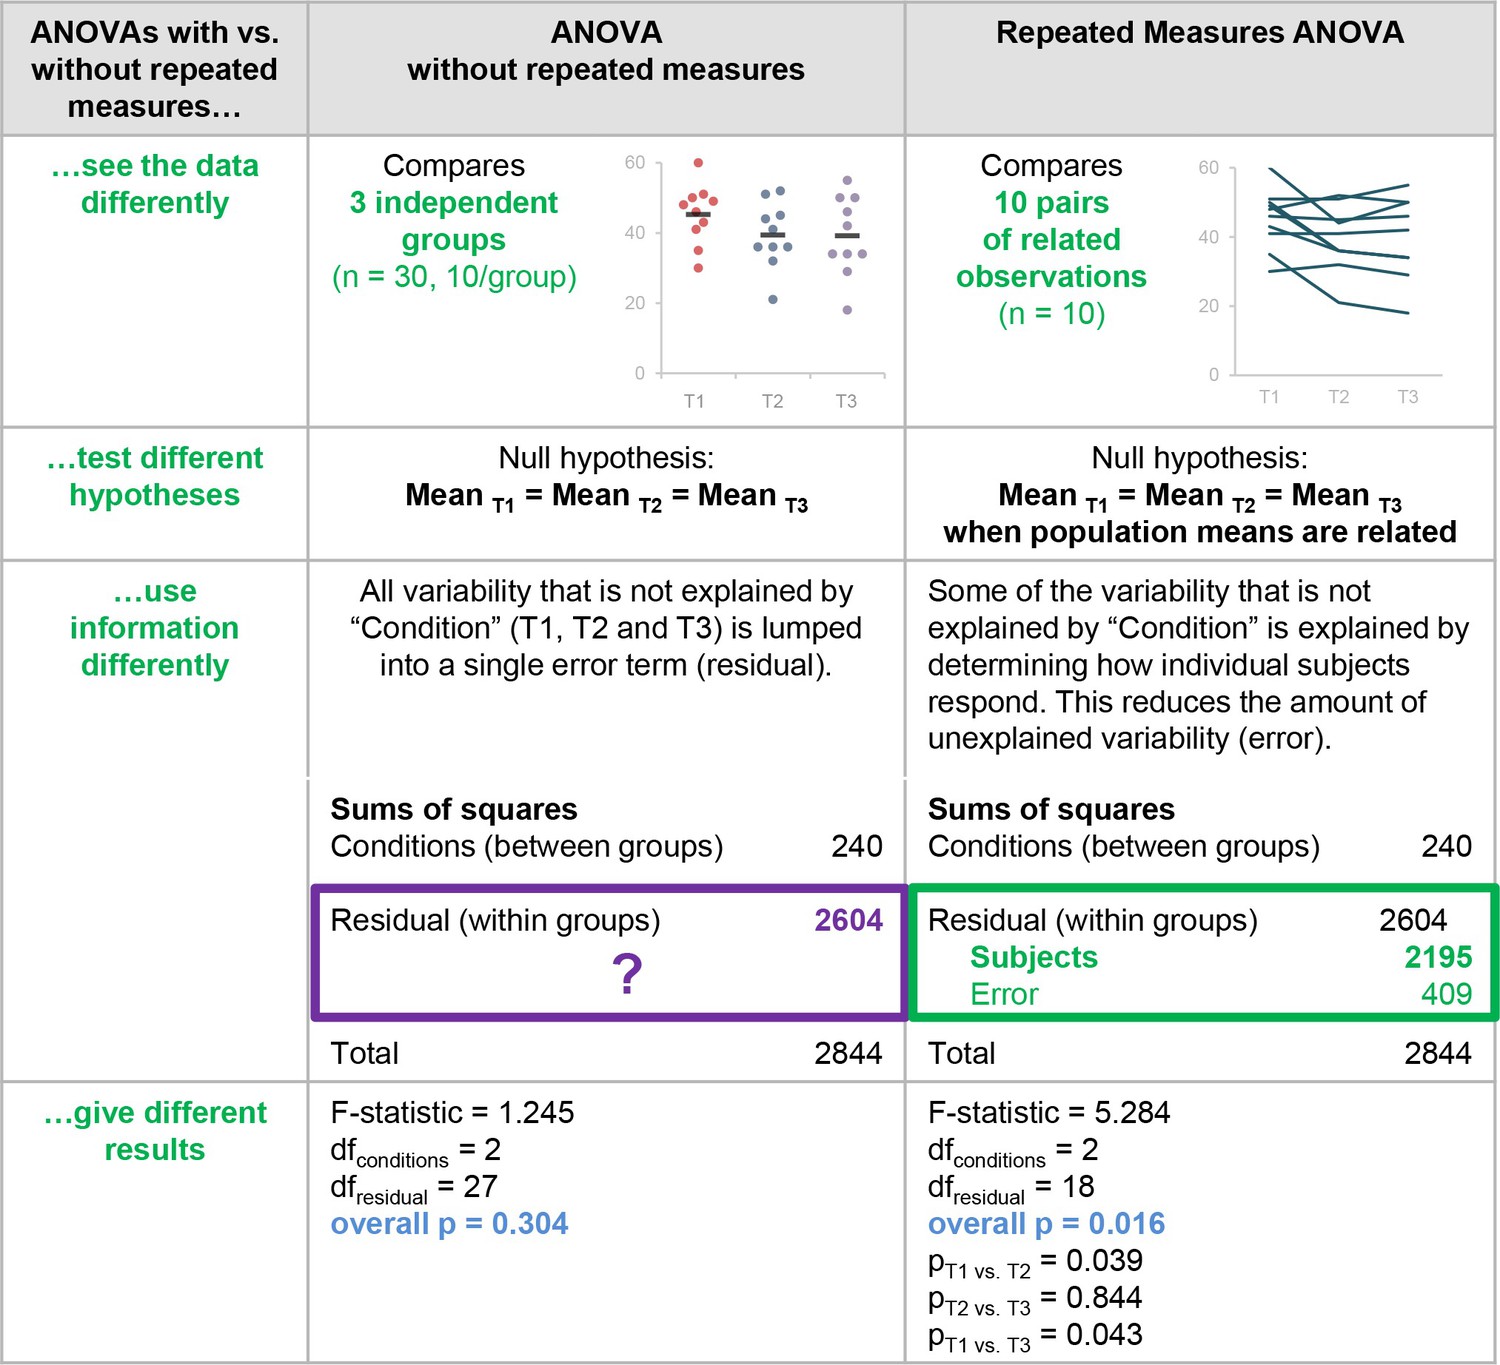
Bar graphs
t <- melt(tapply(ToothGrowth$len, ToothGrowth[, c("dose", "supp")], mean), value.name = "len") # dose supp len # 1 0.5 OJ 13.23 # 2 1.0 OJ 22.70 # 3 2.0 OJ 26.06 # 4 0.5 VC 7.98 # 5 1.0 VC 16.77 # 6 2.0 VC 26.14 ggplot(t, aes(x=dose, y=len, group=supp)) + geom_line(aes(linetype=supp, color=supp)) + geom_point(aes(color=supp), size=5) + scale_color_brewer(palette="Dark2") + theme_bw() + labs(title="line plot") |

t$dose <- factor(t$dose) t$sd <- melt(tapply(ToothGrowth$len, ToothGrowth[, c("dose", "supp")], sd))$value # 4.46 3.91 2.66 2.75 2.52 4.80 ggplot(t, aes(x=dose, y=len, fill=supp)) + geom_bar(stat="identity", position=position_dodge()) + geom_errorbar(aes(ymin=len-sd, ymax=len+sd), width=.2, position=position_dodge(.9)) + scale_fill_brewer(palette="Reds") + theme_minimal() + labs(title="The Effect of Vitamin C on\nTooth Growth in Guinea Pigs") |

Tooth <- summarySE(ToothGrowth,"len",c("supp","dose")) # supp dose N len sd se ci # 1 OJ 0.5 10 13.23 4.46 1.410 3.19 # 2 OJ 1.0 10 22.70 3.91 1.237 2.80 # 3 OJ 2.0 10 26.06 2.66 0.840 1.90 # 4 VC 0.5 10 7.98 2.75 0.869 1.96 # 5 VC 1.0 10 16.77 2.52 0.795 1.80 # 6 VC 2.0 10 26.14 4.80 1.517 3.43 Tooth$dose <- factor(Tooth$dose) identical(t, Tooth[,c(2,1,4,5)]) # [1] TRUE |
# Error bars represent standard error of the mean ggplot(Tooth, aes(x=dose, y=len, fill=supp)) + geom_bar(position=position_dodge(.9), stat="identity") + geom_errorbar(aes(ymin=len-se, ymax=len+se), width=.2, # Width of the error bars position=position_dodge(.9)) |

# Use 95% confidence intervals instead of SEM ggplot(Tooth, aes(x=dose, y=len, fill=supp)) + geom_bar(position=position_dodge(), stat="identity") + geom_errorbar(aes(ymin=len-ci, ymax=len+ci), width=.2, # Width of the error bars position=position_dodge(.9)) |

ggplot(Tooth, aes(x=dose, y=len, fill=supp)) + geom_bar(position=position_dodge(), stat="identity", colour="black", # Use black outlines, size=.3) + # Thinner lines geom_errorbar(aes(ymin=len-se, ymax=len+se), size=.3, # Thinner lines width=.2, position=position_dodge(.9)) + xlab("Dose (mg)") + ylab("Tooth length") + scale_fill_hue(name="Supplement type", # Legend label, use darker colors breaks=c("OJ", "VC"), labels=c("Orange juice", "Ascorbic acid")) + ggtitle("The Effect of Vitamin C on\nTooth Growth in Guinea Pigs") + scale_y_continuous(breaks=0:20*4) + theme_bw() |

Line graphs
sd
The errorbars overlapped, so use position_dodge to move them horizontally
pd <- position_dodge(0.1) # move them .1 to the left and right ggplot(Tooth, aes(x=dose, y=len, colour=supp)) + geom_errorbar(aes(ymin=len - se, ymax=len + se), width=.1, position=pd) + geom_point(position=pd) |

ci
ggplot(Tooth, aes(x=dose, y=len, colour=supp)) + geom_errorbar(aes(ymin=len-ci, ymax=len+ci,colour = supp), width=.1, position=pd) + geom_point(position=pd, size=3) |

ggplot(Tooth, aes(x=dose, y=len, colour=supp)) + geom_errorbar(aes(ymin=len-se, ymax=len+se,colour = supp), width=.1, position=pd) + geom_point(position=pd, size=3, shape=21, fill="white") + # 21 is filled circle xlab("Dose (mg)") + ylab("Tooth length") + scale_colour_hue(name="Supplement type", # Legend label, use darker colors breaks=c("OJ", "VC"), labels=c("Orange juice", "Ascorbic acid"), l=40) + # Use darker colors, lightness=40 ggtitle("The Effect of Vitamin C on\nTooth Growth in Guinea Pigs") + expand_limits(y=0) + # Expand y range scale_y_continuous(breaks=0:20*4) + # Set tick every 4 theme_bw() + theme(legend.justification=c(1,0), legend.position=c(1,0)) # Position legend in bottom right |

Within-subjects variables
When all variables are between-subjects, it is straightforward to plot standard error or confidence intervals.
However, when there are within-subjects variables (repeated measures), plotting the standard error or regular confidence intervals may be misleading for making inferences about differences between conditions.
The method below is from Morey (2008)
See these papers for a more detailed treatment of the issues involved in error bars with within-subjects variables.
Here is a data set (from Morey 2008) with one within-subjects variable: pre/post-test.
dfw <- read.table(header=TRUE, text=' subject pretest posttest 1 59.4 64.5 2 46.4 52.4 3 46.0 49.7 4 49.0 48.7 5 32.5 37.4 6 45.2 49.5 7 60.3 59.9 8 54.3 54.1 9 45.4 49.6 10 38.9 48.5 ') dfw_long <- melt(dfw, id.vars = "subject", variable.name = "condition") |
# Use a consistent y range ymax <- max(dfw_long$value) ymin <- min(dfw_long$value) # Plot the individuals ggplot(dfw_long, aes(x=condition, y=value, colour=factor(subject), group=factor(subject))) + geom_line() + geom_point(shape=21, fill="white") + ylim(ymin,ymax) |

# Create the normed version of the data dfwNorm.long <- normDataWithin(data=dfw_long, idvar="subject", measurevar="value") # Plot the normed individuals ggplot(dfwNorm.long, aes(x=condition, y=value_norm, colour=factor(subject), group=factor(subject))) + geom_line() + geom_point(shape=21, fill="white") + ylim(ymin,ymax) |

The differences in the error bars for the regular (between-subject) method and the within-subject method are shown here. The regular error bars are in red, and the within-subject error bars are in black.
dfwc_between <- summarySE(data=dfw_long, measurevar="value", groupvars="condition", na.rm=FALSE, conf.interval=.95) # condition N value sd se ci # 1 pretest 10 47.7 8.60 2.72 6.15 # 2 posttest 10 51.4 7.25 2.29 5.19 # Show the between-S CI's in red, and the within-S CI's in black dfwc <- summarySEwithin(dfw_long, measurevar="value", withinvars="condition", idvar="subject", na.rm=FALSE, conf.interval=.95) ggplot(dfwc_between, aes(x=condition, y=value, group=1)) + geom_line() + geom_errorbar(width=.1, aes(ymin=value-ci, ymax=value+ci), colour="red") + geom_errorbar(width=.1, aes(ymin=value-ci, ymax=value+ci), data=dfwc) + geom_point(shape=21, size=3, fill="white") + ylim(ymin,ymax) |

Two within-subjects variables
data <- read.table(header=TRUE, text=' Subject RoundMono SquareMono RoundColor SquareColor 1 41 40 41 37 2 57 56 56 53 3 52 53 53 50 4 49 47 47 47 5 47 48 48 47 6 37 34 35 36 7 47 50 47 46 8 41 40 38 40 9 48 47 49 45 10 37 35 36 35 11 32 31 31 33 12 47 42 42 42 ') data_long <- melt(data=data, id.var="Subject", variable.name="Condition") names(data_long)[names(data_long)=="value"] <- "Time" vview(data_long) |
## # A tibble: 10 x 4 ## rowname Subject Condition Time ## * <fct> <int> <fct> <int> ## 1 1 1 RoundMono 41 ## 2 2 2 RoundMono 57 ## 3 3 3 RoundMono 52 ## 4 4 4 RoundMono 49 ## 5 5 5 RoundMono 47 ## 6 44 8 SquareColor 40 ## 7 45 9 SquareColor 45 ## 8 46 10 SquareColor 35 ## 9 47 11 SquareColor 33 ## 10 48 12 SquareColor 42 |
In this case, the column names indicate two variables, shape (round/square) and color scheme (monochromatic/colored).
# Split Condition column into Shape and ColorScheme data_long$Shape <- NA data_long$Shape[grepl("^Round", data_long$Condition)] <- "Round" data_long$Shape[grepl("^Square", data_long$Condition)] <- "Square" data_long$Shape <- factor(data_long$Shape) data_long$ColorScheme <- NA data_long$ColorScheme[grepl("Mono$", data_long$Condition)] <- "Monochromatic" data_long$ColorScheme[grepl("Color$", data_long$Condition)] <- "Colored" data_long$ColorScheme <- factor(data_long$ColorScheme, levels=c("Monochromatic","Colored")) # Remove the Condition column now data_long$Condition <- NULL # Look at first few rows vview(data_long) |
## # A tibble: 10 x 5 ## rowname Subject Time Shape ColorScheme ## * <fct> <int> <int> <fct> <fct> ## 1 1 1 41 Round Monochromatic ## 2 2 2 57 Round Monochromatic ## 3 3 3 52 Round Monochromatic ## 4 4 4 49 Round Monochromatic ## 5 5 5 47 Round Monochromatic ## 6 44 8 40 Square Colored ## 7 45 9 45 Square Colored ## 8 46 10 35 Square Colored ## 9 47 11 33 Square Colored ## 10 48 12 42 Square Colored |
datac <- summarySEwithin(data_long, measurevar="Time", withinvars=c("Shape","ColorScheme"), idvar="Subject") # Shape ColorScheme N Time Time_norm sd se ci # 1 Round Colored 12 43.6 43.6 1.21 0.350 0.770 # 2 Round Monochromatic 12 44.6 44.6 1.33 0.384 0.846 # 3 Square Colored 12 42.6 42.6 1.46 0.422 0.929 # 4 Square Monochromatic 12 43.6 43.6 1.26 0.364 0.801 library(ggplot2) ggplot(datac, aes(x=Shape, y=Time, fill=ColorScheme)) + geom_bar(position=position_dodge(.9), colour="black", stat="identity") + geom_errorbar(position=position_dodge(.9), width=.25, aes(ymin=Time-ci, ymax=Time+ci)) + coord_cartesian(ylim=c(40,46)) + scale_fill_manual(values=c("#CCCCCC","#FFFFFF")) + scale_y_continuous(breaks=seq(1:100)) + theme_bw() + geom_hline(yintercept=38) |

The normed means are calculated so that means of each between-subject group are the same. These values can diverge when there are between-subject variables.
dat <- read.table(header=TRUE, text=' id trial gender dv A 0 male 2 A 1 male 4 B 0 male 6 B 1 male 8 C 0 female 22 C 1 female 24 D 0 female 26 D 1 female 28 ') # normed and un-normed means are different summarySEwithin(dat, measurevar="number", withinvars="trial", betweenvars="gender", idvar="id") |
## gender trial N dv dv_norm sd se ci ## 1 female 0 2 24 14 0 0 0 ## 2 female 1 2 26 16 0 0 0 ## 3 male 0 2 4 14 0 0 0 ## 4 male 1 2 6 16 0 0 0 |
# Automatically converting the following non-factors to factors: trial # gender trial N dv dv_norm sd se ci # 1 female 0 2 24 14 0 0 0 # 2 female 1 2 26 16 0 0 0 # 3 male 0 2 4 14 0 0 0 # 4 male 1 2 6 16 0 0 0 |