R Distributions
The Normal Distribution
- dnorm(x, mean = 0, sd = 1, log = FALSE)
- pnorm(q, mean = 0, sd = 1, lower.tail = TRUE, log.p = FALSE)
- qnorm(p, mean = 0, sd = 1, lower.tail = TRUE, log.p = FALSE)
- rnorm(n, mean = 0, sd = 1)
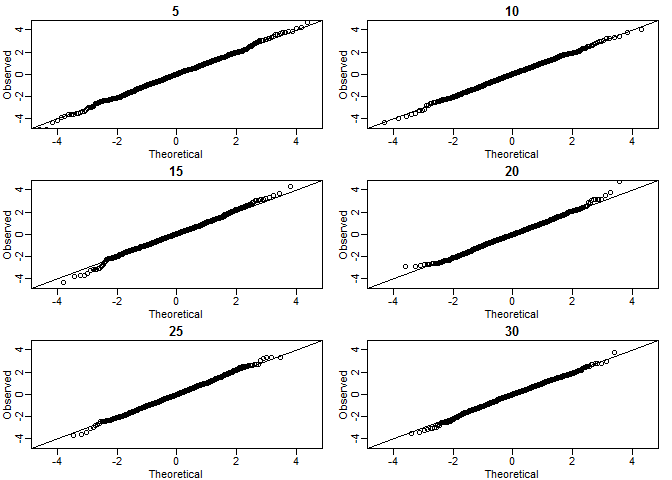
CLT: When we take many samples of size \(N\), the distribution of samples is approximated with a normal distribution centered at 0 and with standard deviation 1.
\[ \frac{\bar{Y} - \mu}{\sigma_Y/\sqrt{N}} \]
pnorm(-1.96) + (1 - pnorm(1.96)) # 0.04999579 |
Random Normal
set.seed(1) rnorm(10) # [1] -0.6264538 0.1836433 -0.8356286 1.5952808 0.3295078 -0.8204684 0.4874291 # [8] 0.7383247 0.5757814 -0.3053884 # Use a different mean and standard deviation rnorm(10, mean=5, sd=1) # [1] 6.511781 5.389843 4.378759 2.785300 6.124931 4.955066 4.983810 5.943836 5.821221 # [10] 5.593901 |
Uniform
Random Uniform
runif(1) # [1] 0.09006613 # Get a vector of 4 numbers runif(4) # [1] 0.6972299 0.9505426 0.8297167 0.9779939 # Get a vector of 3 numbers from 0 to 100 runif(3, min=0, max=100) # [1] 83.702278 3.062253 5.388360 # Get 3 integers from 0 to 100 # Use max=101 because it will never actually equal 101 floor(runif(3, min=0, max=101)) # [1] 11 67 1 |
Hyper
Supposed that Group A : 50, GroupB :60, Total = 200 Calculate the \[p(A\cap B = 30)\] p.value = phyper(p1.and.p2 -1, p2, totalTest-p2, p1, lower.tail = FALSE,log.p = FALSE)
pval <- 1-phyper(30-1, 60, 200-60, 50) pval # [1] 2.555588e-07 1-phyper(30-1, 50, 200-50, 60) # [1] 2.555588e-07 sum(sapply(30:50, dhyper, m=60, n=200-60, k=50)) # [1] 2.555588e-07 |
All articles in this blog are licensed under CC BY-NC-SA 4.0 unless stating additionally.
Related Articles

Comment